The Navigator, shown in Figure 3-1, shows the physical relationships between project files and folders on disk. The Navigator does not show the logical relationships between files in a project. To display the logical relationships, you must use the project model diagram. The project model diagram shows, from top to bottom:
The project model diagram also shows data sets, data designs, report libraries, cache connection definitions, cache objects, and external procedures. Downward-pointing arrows show the dependencies between files.
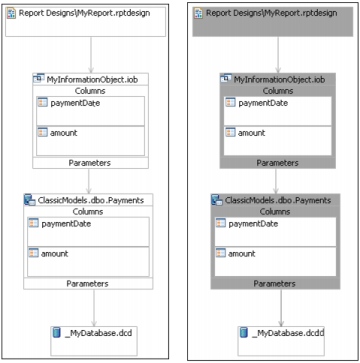
For example, the project model diagram on the left in Figure 6-4 shows the following dependencies:
|
|
The report design MyReport.rptdesign is dependent on the information object MyInformationObject.iob.
|
|
|
MyInformationObject.iob is dependent on the map ClassicModels.dbo.Payments.
|
The project model diagram can help you assess the impact of a change to a file, column, or parameter by highlighting the impact path in red. For example, the project model diagram on the right in Figure 6-4 shows the impact of a change to ClassicModels.dbo.Payments. MyReport.rptdesign, MyInformationObject.iob, ClassicModels.dbo.Payments, and the arrows connecting them are highlighted in red to indicate that a change to the map impacts the information object and the report design.
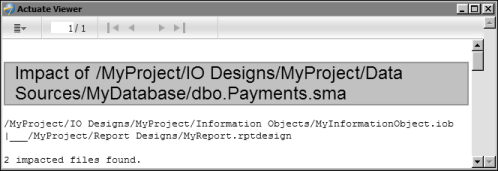
You can display a report that lists the files impacted by a change to a file or column. For example, Figure 6-5 shows a report that lists the files impacted by a change to dbo.Payments.sma.
|
Figure 6-5
|