Using the animation effect, you can animate different parts of a chart or gadget, including the background, title, data plot, data values, x-axis labels, y-axis labels, and more. After selecting the object to animate, you set properties to define how the object moves, including the direction, pattern, and duration of the animation.
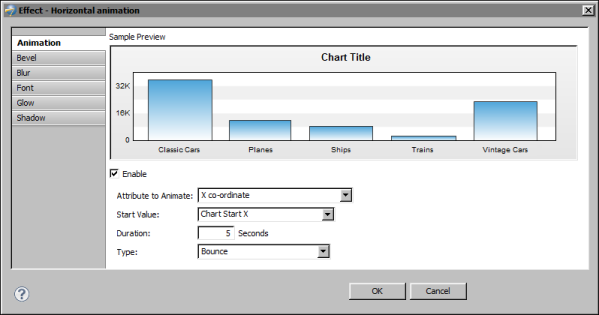
For example, you can animate the data plot of a column chart so that the columns are drawn from the left side of the chart to the right side in five seconds, with a bouncing motion at the end. Figure 17-29 shows the properties set to create this type of animation. The Attribute to Animate value of X coordinate specifies that the x (horizontal) position of the plot is animated. The Start Value setting of Chart Start X specifies that the animation starts from the left side of the chart.
|
Figure 17-29
|
Table 17-16 describes the animation properties.
|
Table 17-16
|
Attribute To Animate
Specifies the property of the object to animate as described in Table 17-17. Each attribute produces different movements. Not all attributes apply to all chart objects. For example, the rotation attribute applies only to the data plot of a pie and doughnut chart.
Specifies the start position of the animation. Either specify a fixed pixel location or select a macro. Macros are useful for setting a start x or y position at the start, center, or end position of chart. Without a macro, such as Chart Center X, you would have to experiment with many x values to find the center of the chart. Macros are described in Table 17-18.
Specifies the type of animation as described in Table 17-19. The animation type determines acceleration and deceleration during animation. For example, a chart object might gradually increase its speed near the beginning of an animation, but slow down at the end of the animation.
Table 17-17 describes the attributes of a chart part, or object, that you can animate.
|
Table 17-17
|
Animates the x (horizontal) scale of the object. For example, for the data plot of a column chart, the columns are animated to grow widthwise.
Animates the y (vertical) scale of the object. For example, for the data plot of a column chart, the columns are animated to grow in height.
Animates the x position of the object.
Animates the y position of the object.
Table 17-18 describes the macros that you can select for the Start Value property described in Table 17-16. Chart refers to the entire area of the Flash chart or gadget. Canvas refers to the plot area.
|
Table 17-18
|
The start x position of the chart, which is equal to 0
The start y position of the chart, which is equal to 0
The end x position of the chart, which is the same as the chart width
The end y position of the chart, which is the same as the chart height
The center x position of the chart
The center y position of the chart
The center x position of the canvas
The center y position of the canvas
Table 17-19 describes the type of animation that you can select for the Type property described in Table 17-16.
|
Table 17-19
|
Adds a bouncing motion at the end of the animation. The number of bounces relates to the duration. Longer durations produce more bounces.
Adds an elastic motion at the end of the animation. The range of motion is larger than that of the bounce. The amount of elasticity is unaffected by duration.
Adds a smooth movement from start to end of the animation without any changes in speed.