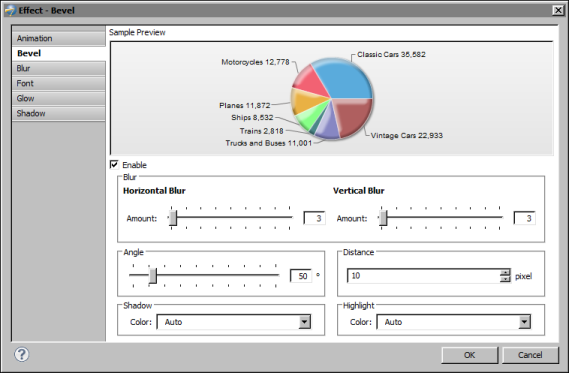
Use the bevel effect to create bevels on chart and gadget objects. This effect is typically applied to a data plot, as shown in Figure 17-30. As the figure shows, the bevel makes the pie chart appear more three-dimensional. By setting properties, you can control the angle, depth, and color of the bevel.
|
Figure 17-30
|
Table 17-20 describes the bevel properties.
|
Table 17-20
|