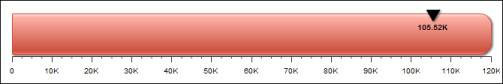
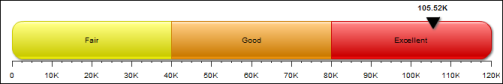
Region properties enable the division of the data plot into regions. Use regions to provide more information about values in a gadget. Compare the linear gauges in the following figures. The gauge in Figure 17-10 does not show regions. The gauge in Figure 17-11 displays three regions, labeled Fair, Good, and Excellent.
|
Figure 17-10
|
|
Figure 17-11
|
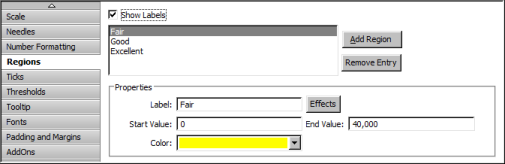
Figure 17-12 shows the properties set for the region labeled Fair in Figure 17-11.
|
Figure 17-12
|
Table 17-6 shows all region properties and lists the gadgets to which they apply.
|
Table 17-6
|
Chooses the region for which the settings apply. You can also add or remove a region from the list.