|
Task 10:
|
Now that you verified that the map displays the correct sales data for the territories, you can focus on adding functionality and visual interest to the map. Perform the following tasks in this section:
In this procedure, format the sales value so that it displays $4.52M instead of 4,520,712.27999999. Also, specify that the sales values appear on the map in the following format:
|
2
|
Select the Flash object. In Property Editor, choose Flash Variables, select the dataXML variable, and choose Edit.
|
|
4
|
In the line that defines the XML (the line that begins with "<map>), add the text shown in bold. You must type the entire XML string in a single line.
|
"<map decimals='2' formatNumberScale='1' numberPrefix='$' includeValueInLabels='1' labelSepChar=': '><data>" + g_dataPart + "</data></map>"
As you add attributes, the XML string becomes increasingly difficult to type and read as a single line in the expression builder. This procedure shows how to build the XML string piece by piece.
|
2
|
Edit the dataXML expression in the expression builder. Replace the line that defines the XML string (the line that begins with "<map>) with the following lines:
|
The str variable stores the XML string. The += operator adds each successive piece of string to the current string. By building the XML string in pieces, you can read, edit, delete, and add attributes easily. As the example shows, you can also add comments about the purpose of the attributes.
|
4
|
Preview the report to ensure that the map displays correctly. The expression builder’s validation does not verify that the XML string contains valid content.
|
In this procedure, change the fill and background colors of the map. Use Hex codes for the color values.
|
2
|
Edit the dataXML expression in the expression builder. Add the following lines before the str += ">" line:
|
In this procedure, categorize the sales data into the following ranges, and apply a different color to each range:
|
2
|
Edit the dataXML expression in the expression builder. Add the following lines after the str += ">" line. Each str line must be a single line.
|
str += "<color minValue='0' maxValue='1000000' displayValue='Below target' color='CCFF99' />"
str += "<color minValue='1000001' maxValue='4000000' displayValue='Within target' color='66CCFF' />"
str += "<color minValue='4000001' maxValue='8000000' displayValue='Above target' color='FFDDFF' />"
In this procedure, display markers for these cities in which there are sales offices: New York, Paris, San Francisco, and Tokyo. To display markers, define the properties of each marker, including a user-specified ID, its XY position, the label to display, and the position of the label relative to the marker. You can also specify the shape, size, and color of each marker. After defining the markers, create the list of markers to display on the map.
|
2
|
Edit the dataXML expression in the expression builder. Add the following lines after the data range definition, that is, after the str += "</colorRange>" line. Each str line must be a single line.
|
str += "<marker id='NYC' x='210' y='140' label='New York' labelPos='bottom' />"
str += "<marker id='PAR' x='360' y='130' label='Paris' labelPos='bottom' />"
str += "<marker id='TOK' x='630' y='160' label='Tokyo' labelPos='right' />"
str += "<marker id='SFO' x='80' y='163' label='San Francisco' labelPos='left' />"
str += "<shape id='TOKdot' type='circle' radius='3' fillColor='ffd700' labelPadding='+1' /> "
str += "<shape id='PARdot' type='circle' radius='3' fillColor='ffd700' labelPadding='-2' /> "
str += "<shape id='NYCdot' type='circle' radius='3' fillColor='ffd700' labelPadding='+1' /> "
str += "<shape id='SFOdot' type='circle' radius='3' fillColor='ffd700' labelPadding='+1' /> "
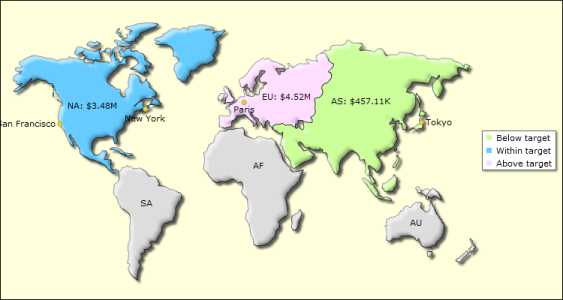
The map should look like the one shown in Figure 18-20. The territories with sales data appear in different colors. A legend displaying the data range colors and labels appears on the right. The map displays circular markers and labels for San Francisco, New York, Paris, and Tokyo.
|
Figure 18-20
|
This tutorial demonstrates only a few of the attributes that you can use to format and manipulate a Flash map. For a complete list and descriptions of the attributes, see the Flash map help.