Defining the visual attributes is straightforward. Simply use the attribute='value' format for each attribute; for example, color='8BBA00'. Defining the data, however, requires programming to iterate through a data set and retrieve values from each row of data.
The following examples include code snippets, which show how to accomplish this task using JavaScript. For complete programming examples using JavaScript and Java, review the tutorials later in this chapter.
In the doughnut chart example shown in Figure 18-8, data is defined using the <set> tag and the following format:
The code you write must get values from two columns, one that stores business division values, and another that stores revenue values. Assume that the data set providing the data values returns rows as shown in Figure 18-10.
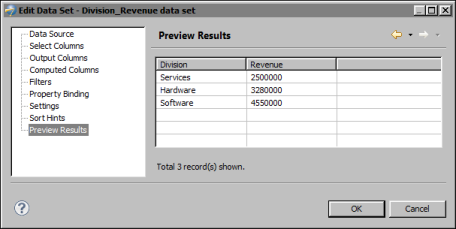
The JavaScript code for getting the division and revenue values from a data set row and creating a single <set> line would look like the following:
setData = setData + "label='" + this.getRowData().getColumnValue("Division") + "'";
setData = setData + "value='" + this.getRowData().getColumnValue("Revenue") + "'/>";
In the multi-series chart example shown in Figure 18-9, category data is defined within the <categories> tag using the <category> tag in the following format:
The code you write gets values from three columns in each data set row. Assume that the data set providing the data values returns rows as shown in Figure 18-11.
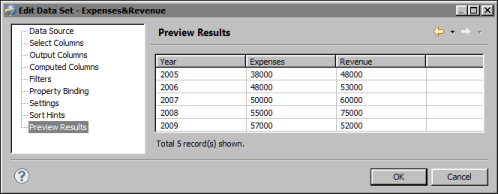
The JavaScript code for getting the column values from each data set row would look like the following:
var YearData = "<category label='" + this.getRowData().getColumnValue("Year")+ "'/>";
var ExpenseData = "<set value='" + this.getRowData().getColumnValue("Expenses") + "'/>";
var RevenueData = "<set value='" + this.getRowData().getColumnValue("Revenue") + "'/>";