Cross tabs typically aggregate and display data by time periods because time is an essential part of data analysis. Any analysis of stock performance, revenue, or productivity is meaningful only if it can be measured by day, week, month, quarter, or year. Support for displaying data by a specific time period has been available since the introduction of cross tabs in open-source BIRT Report Designer. For example, a cross tab can display revenue data for a particular month, quarter, or year.
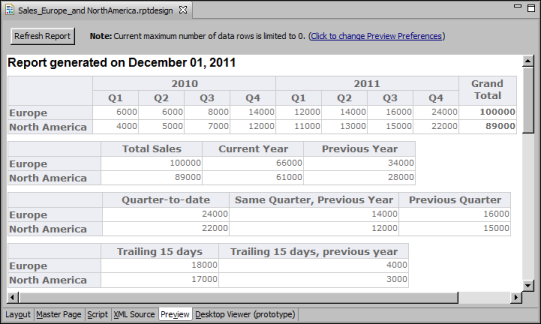
In Actuate BIRT Designer, cross tabs are enhanced to support relative time periods, such as current month, previous month, year-to-date, quarter-to-date, quarter-to-date in the previous year, trailing 30 days, and so on. Displaying data by relative time periods supports, for example, the comparison of current data with past data of the same period. Figure 21-1 shows a report that displays sales data in four cross tabs. All the cross tabs use data from the same cube.
|
|
The second cross tab displays total sales, sales in the current year (2011), and sales in the previous year (2010).
|
|
|
The third cross tab displays the quarter-to-date sales in the current year and, as comparison, sales for the same period in the previous year, and sales in the previous quarter.
|
|
|
The fourth cross tab compares sales in the previous 15 days with the same period the previous year.
|
|
Figure 21-1
|
The first cross tab represents the typical way of displaying a measure (sales) by two dimensions (a region dimension and a time dimension) defined in a cube. The other cross tabs aggregate data by region and by relative time periods. The procedures for aggregating the sales data by the relative time periods shown in the examples are described later in this chapter. For information about building cubes and cross tabs, see BIRT: A Field Guide.