|
1
|
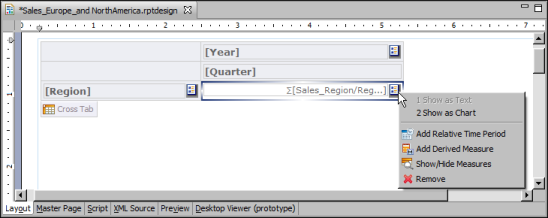
In the detail area of a cross tab, insert a relative time period element. To do so, click the button next to a measure, as shown in Figure 21-2, and choose Add Relative Time Period.
|
|
Figure 21-2
|
|
2
|
In Relative Time Period Aggregation Builder, specify the properties of the relative time period measure. All properties are required unless described as optional.
|
|
|
In Display Name (optional), type an alternate name to display in the report design. If one is not specified, the report design displays the Column Binding Name value.
|
|
|
In Data Type, select a data type appropriate for the measure. The default type, Float, provides the best performance and a high precision level.
|
|
|
In Time Period, select the desired time period in which to aggregate the data. For example, to calculate sales totals for the current month, select Current Month. The time periods are described in Table 21-1 later in this chapter. Some time periods, such as Previous N Months, require additional property values, which appear immediately below Time Period.
|
|
|
In Function, select the function to perform the desired aggregate calculation. The default function, SUM, adds up all the measure values. For information about each aggregate function, see BIRT: A Field Guide.
|
|
|
In Expression, select the measure whose values to aggregate, or specify an expression. The drop-down list displays the measures used in the cross tab.
|
|
|
In Filter Condition (optional), specify an expression to include only certain measure values from the aggregate calculation. For example, specify a filter, such as measure["SalesAmount"] > 100, to include only sales amounts over 100 in the calculation.
|
|
|
In Aggregate On, select the dimension or dimensions by which to aggregate the measure data. The dimensions used in the cross tab are selected by default.
|
|
|
In Time Dimension, select the time dimension that contains the date values to use in the relative time period calculation. The drop-down list displays all the time dimensions defined in the cube. The time dimension inserted in the cross tab, if any, is selected by default. If you did not insert a time dimension in the cross tab, the first time dimension defined in the cube is selected by default. In the example report shown in Figure 21-1, the first cross tab displays a time dimension (dates are grouped by year and quarter), but the other cross tabs do not.
|
|
|
In Reference Date, specify the date that is the basis for calculating the specific period for aggregating data. Select one of the following options:
|
|
|
Today. This option uses the current date (the date on which the report is run) as the reference date. For example, if the relative time period specified in Time Period is Year to Date, and the report is run on 12/01/2011, BIRT aggregates the data for the year up to, and including, 12/01/2011.
|
|
|
This date. This option uses a fixed date value, which you specify, as the reference date. If the time period is Year to Date, and you specify 09/30/2011, BIRT aggregates the data for the year up to, and including, 09/30/2011. You can use the Calender tool in the expression builder to select a date, or type a date value in one of the following formats:
|
|
|
Most recent date in Time Dimension. This option uses the latest date in the dimension specified in the Time Dimension property as the reference date. For example, if the time dimension contains the dates 07/07/2011, 11/30/2011, and 09/19/2011, the date 11/30/2011 is used as the reference date. This option is available only if the cross tab contains a time dimension.
|