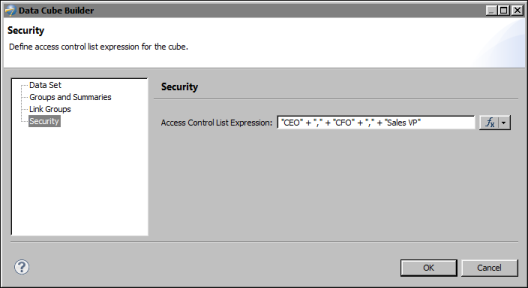
To apply security to a cube, in the cube builder, choose Security, then specify the security IDs in Access Control List Expression. Figure 23-21 shows an example where the expression specified for the Access Control List Expression property is:
Only users with the CEO, CFO, or Sales VP role have access to the cube. For example, in a report that contains a cross tab that uses the secured cube, only the CEO, CFO, and Sales VP can view the data in the cross tab. Other users see an empty cross tab. Similarly, in BIRT Studio or BIRT 360, only users with those roles can see and use the secured cube in their report designs or dashboards.
|
Figure 23-21
|
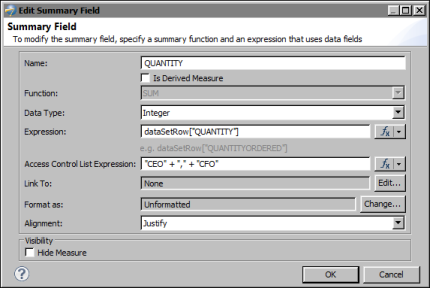
Within a cube, you can limit access to each measure and dimension. For example, you can restrict a profit measure to users with executive-level roles. In the cube builder, choose Groups and Summaries, select the dimension or measure, then specify the security IDs in the Access Control List Expression property.
Figure 23-22 shows an example where the expression specified for a measure’s Access Control List Expression property is:
In a report that contains a cross tab that uses this cube, only the CEO and CFO can view the QUANTITY data in the cross tab.
|
Figure 23-22
|
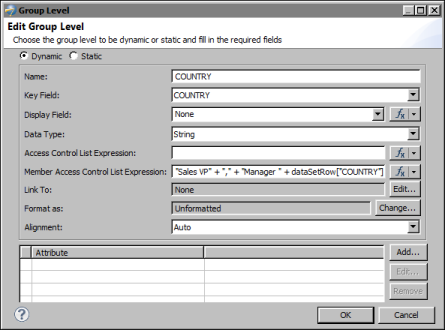
With a dimension, you can also restrict access according to the dimension’s values, or members. For example, you can provide executives access to sales data for all countries and restrict managers to sales data for their respective countries. Figure 23-23 shows security applied to the members of a Country dimension. The expression specified for the Member Access Control List Expression property is:
In this example, the Sales VP can view data for all countries. Managers can view only data for their country.
|
Figure 23-23
|
Notice that the Group Level dialog box, as shown in Figure 23-23, displays two ACL properties. Access Control List Expression controls access to the dimension (users either have access to the entire dimension or not at all), whereas, Member Access Control List Expression controls access to specific data within the dimension.
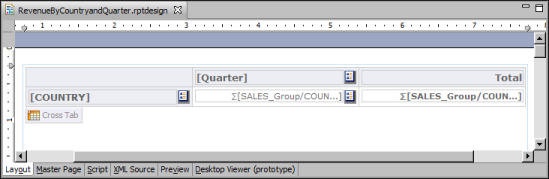
Figure 23-24 shows a report design, which uses the data object that contains the cube with security applied to its country dimension. In the report design, a cross tab uses data from the cube to display sales totals by country and by quarter.
|
Figure 23-24
|
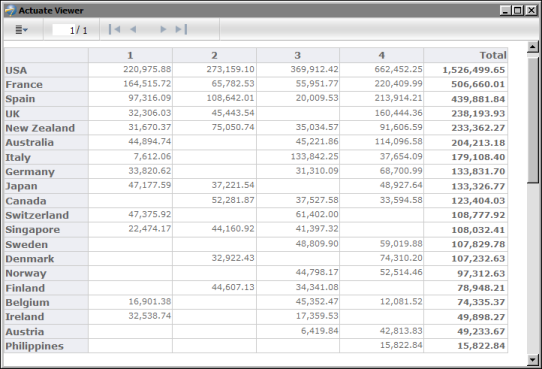
When the report is run and viewed by a user with the Sales VP role, the cross tab displays sales data for all countries, as shown in Figure 23-25.
|
Figure 23-25
|
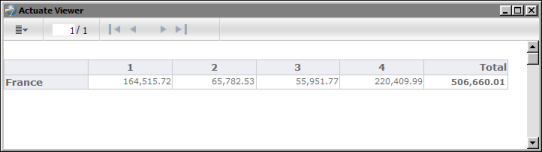
When the report is run and viewed by the manager of a specific country, the cross tab displays only sales data for his or her specific country. Figure 23-26 shows the cross tab that the Manager France role sees.
|
Figure 23-26
|