A line chart displays data values as a set of points connected by a line. You typically use a line chart to present large amounts of data that occur over a continuous period of time. A line chart is the most basic type of chart used in finance.
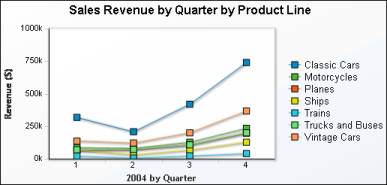
In a line chart, multiple series appear as overlapping lines, as shown in Figure 6-14. A square marker indicates each data value.
|
Figure 6-14
|