|
1
|
|
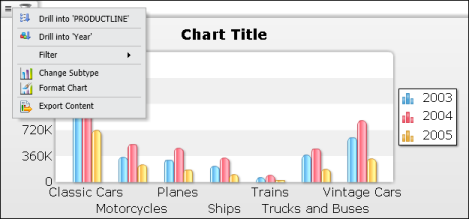
Figure 8-35
|
|
2
|
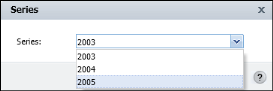
Series appears listing the years for which data is available. Select a year from the list, as shown in Figure 8-36. Choose OK.
|
|
Figure 8-36
|
|
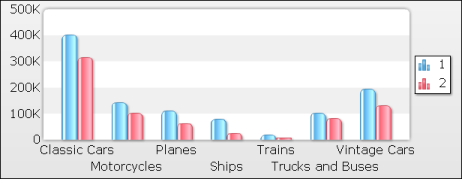
Figure 8-37
|
|
3
|
To drill further into subcategories of the data, from the chart menu, choose Drill into 'Quarter'.
|
|
4
|
Series appears listing the quarters for which data can be viewed. Select the quarter for which you want to view detailed data, then choose OK.
|