If data in a report table or a cross tab is also represented graphically in a chart, in some cases you can switch between the chart view of the data, and the tabular view of the data, using Interactive Viewer. The report developer must set this option when designing the report element and chart, for a user to be able to switch views in Interactive Viewer.
In Interactive Viewer, select the table, and choose Switch View from the main menu. The chart view of the data appears.
If you are working with a cross tab, choose Switch View from the context menu. You can also further Analyze the data in a cross tab, by choosing the Analyze option from the context menu. The cross tab is appears in BIRT Data Analyzer if you have purchased this licensed option.
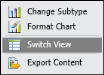
Similarly to switch back to the table view, choose Switch View from the chart menu, as shown in Figure 8-39. The table or cross-tab view of the data appears.
|
Figure 8-39
|