Working with Data Analyzer, you manipulate a cross tab to analyze its data. You can add, remove, reorganize, and customize the data and its appearance in the cross tab to examine relationships and trends. Using Data Analyzer, you can answer questions such as:
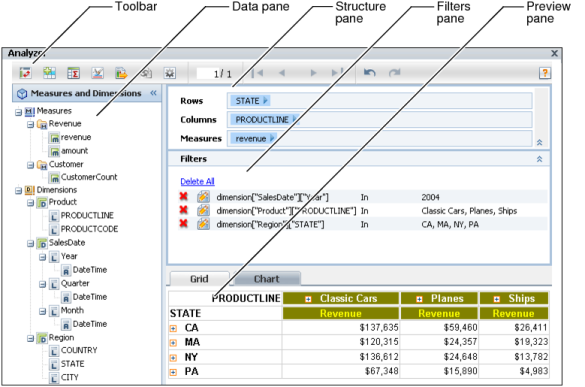
When you start Data Analyzer, your browser displays the following user interface items, as shown in Figure 1-4:
|
|
A toolbar contains buttons that support tasks, such as displaying cross-tab totals and pivoting the cross tab.
|
|
|
A structure pane lists the attributes, dimensions, and measures that appear in the cross-tab columns, rows, and data area.
|
|
Figure 1-4
|
Using the toolbar, shown in Figure 1-4, you can complete the following tasks:
|
|
Choose Export Content to export cross-tab content to a format that is viewable in an application other than Data Analyzer.
|
|
|
Choose Options to orient the measure header, display empty rows and columns, display a character string in empty cells, and apply a page break.
|
|
|
Navigate to other cross-tab pages.
|
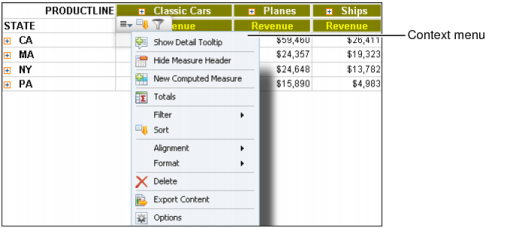
To display additional options for a specific cross-tab element, right-click a cross-tab element. A context menu displays commands and options next to the cross-tab element. For example, Figure 1-5 shows the menu that appears when you right-click a cell in the data area.
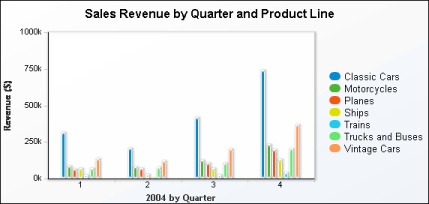
Data Analyzer also supports viewing a chart that uses the cross-tab data. Figure 1-6 shows a column chart that displays revenue values for seven product lines for four quarters.
|
Figure 1-6
|