|
4
|
|
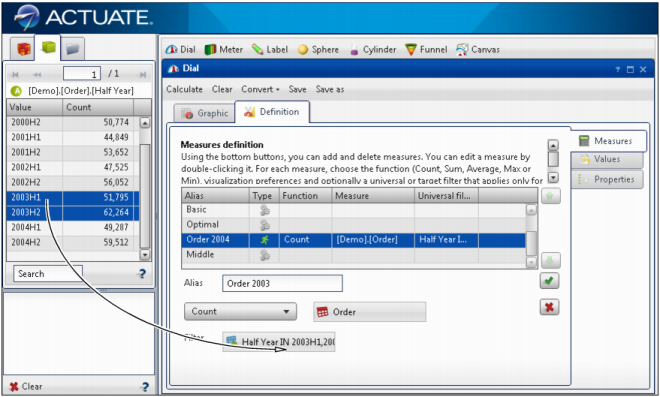
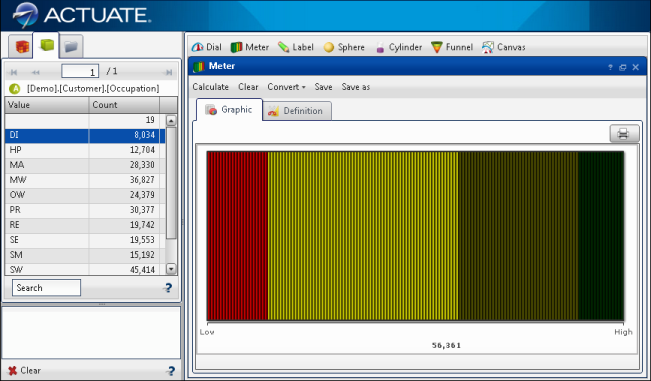
Figure 5-1
|
|
5
|
|
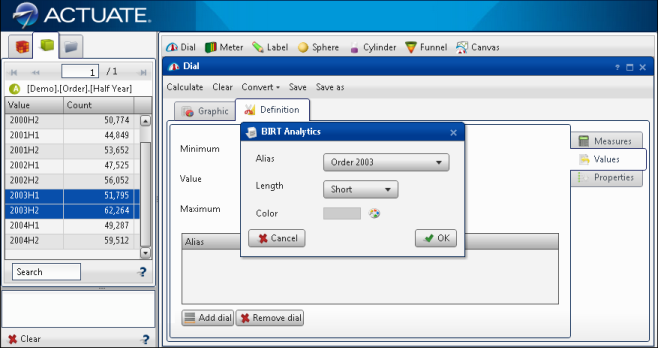
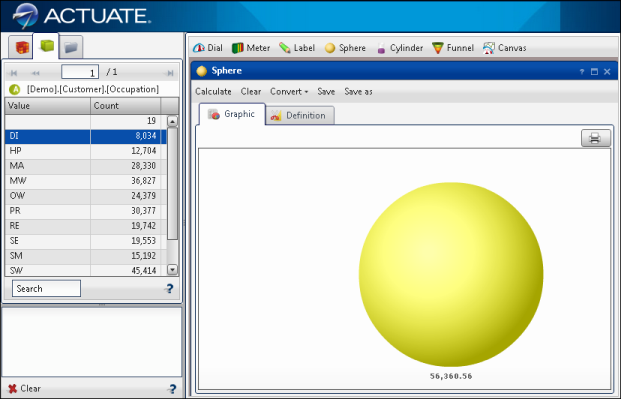
Figure 5-2
|
|
10
|
|
2
|
|
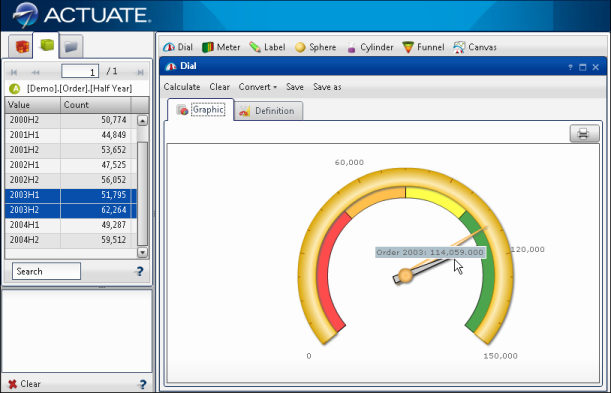
Figure 5-4
|
|
4
|
|
6
|
|
3
|
|
Figure 5-6
|
|
5
|
|
7
|
|
Figure 5-7
|
|
2
|
|
Figure 5-8
|
|
5
|
|
Figure 5-9
|
|
9
|
|
Figure 5-10
|
|
11
|
|
2
|
|
Figure 5-12
|
|
Figure 5-13
|
|
Figure 5-14
|

|
Figure 5-16
|
