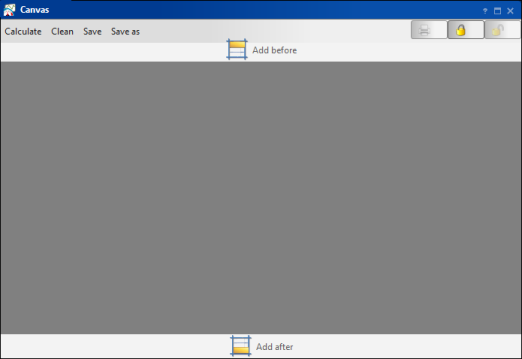
Canvas supports getting summaries of a series of previously defined indicators, for example a collection of indicators that simultaneously displays information about the number and amount of orders. Canvas has two modes, view and edit. The view mode, shown in Figure 5-46, does not allow you to make any modifications to content. The edit mode enables you to add or delete one or more components in the command box.
|
Figure 5-46
|
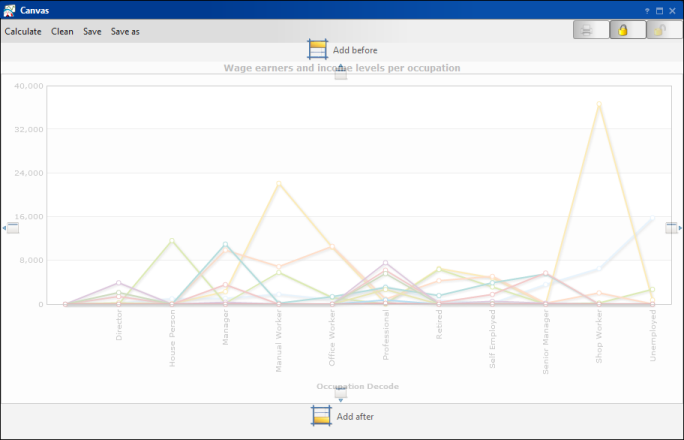
When you drag a component, arrows appear indicating the area where you can drop it, as shown in Figure 5-47.
|
Figure 5-47
|
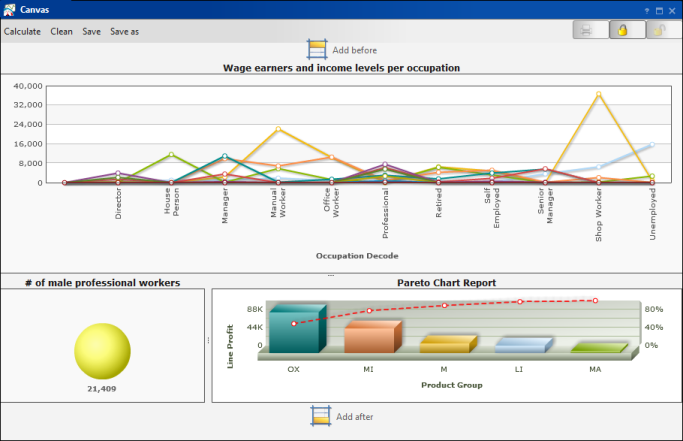
When you drag a new component to Add before or Add after, the analysis is dropped in a new row, as shown in Figure 5-48.
|
Figure 5-48
|
