Using Venn diagrams
Video tutorials
A Venn diagram provides an analysis of data by crossing different fields. A Venn analysis identifies coincidences and differences between N segments. Up to five different segments appear on the graphic display in Chart. Results for segments beyond five appear in Table only.
How to create a Venn diagram analysis
1  
2  
Figure 4-4  
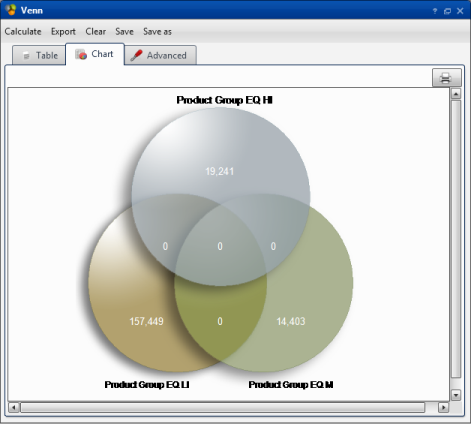
For example, to identify cross-selling opportunities, examine customers who have purchased different categories of products. Using the Venn analysis, cross the data segments representing three different product categories. Zero coincidences occur, because a product is of one type or another, but not both, as shown in Figure 4-5.
Figure 4-5  
A Venn diagram can show coincidences or differences at other levels of database resolution. For example, resolving the Venn diagram at the customer level shows coincidences between the two or three segments, including customers purchasing one, two, or three products.
How to change the resolution
1  
Figure 4-6  
2  
Figure 4-7  
On Advanced, in addition to the resolution table, you can set Filter and Format.
*
You can include a filter at the analysis level, which means that a Venn diagram can be constrained to show results for a specific and smaller universe. For example, include the customers who have purchased one, two, or three product types, but only in Madrid.
*
You can format your results to show a count of values that match the criteria you selected, a percentage of the total number of records included the analysis, or a global percentage, which means that each percentage is based on the total possible records from the resolution table being analyzed.
Related topics
Using BIRT Analytics basic tools
Understanding the sample data model
Video tutorials
Comparing segments using a Venn analysis
Comparing multiple segments using a Venn analysis

Additional Links:

Copyright Actuate Corporation 2013 BIRT Analytics 4.2