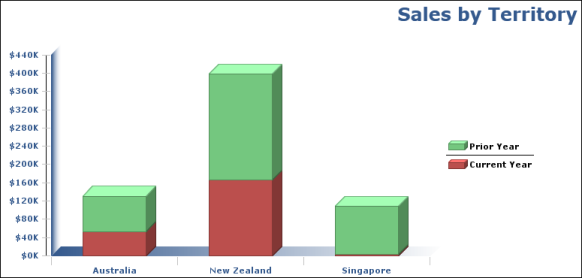
Stacked bar charts show bars stacked one above the other. The stacked bar chart shows totals for each series as well as the proportion that each series contributes to the grand total. The example in Figure 8-2 shows the company’s sales figures for the current year and previous year, in the form of a stacked bar chart.
|
Figure 8-2
|