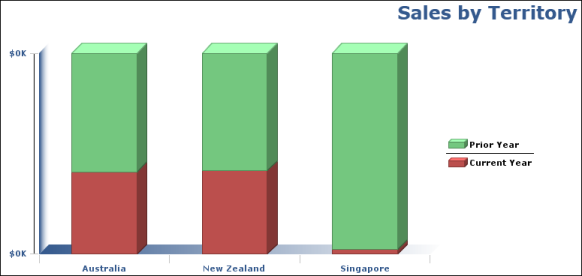
In a percent stacked bar chart, multiple series are stacked vertically and the values appear as a percentage of the whole. The example in Figure 8-3 shows the company’s sales figures by geographical location in terms of a percentage of the whole. Figure 8-3 displays the sales values in percentages instead of the actual numbers shown in the previous bar charts.
|
Figure 8-3
|