How to drill down through a value series to view detailed information
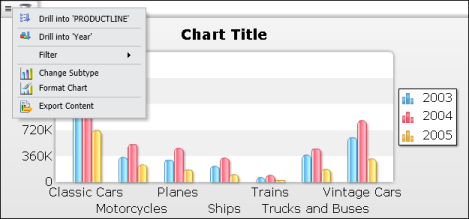
1  
Figure 8-35  
2  
Figure 8-36  
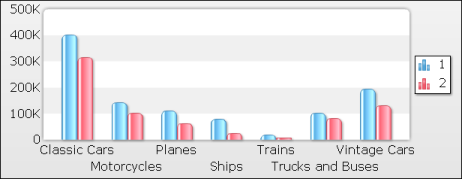
The chart displays data for the selected year, 2005, as shown in Figure 8-37.
Figure 8-37  
3  
4  
The chart displays data for the quarter you selected.

Additional Links:

© Copyright OpenText Corp. All rights reserved. Privacy Policy | Cookie Policy

BIRT iHub 2