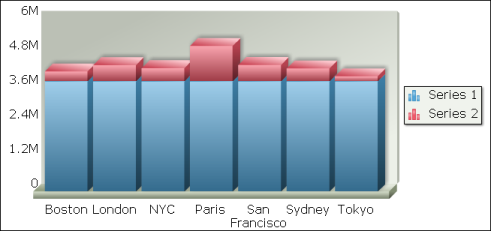
If a Flash chart contains more than one value series, you can also use the legend of the chart to toggle between the series. For example, in Figure 8-52, from the legend, select Series 1 to hide profit values in the chart.
|
Figure 8-52
|
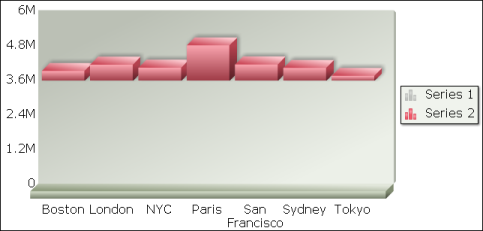
The chart now displays revenue by sales office only, as shown in Figure 8-53. This option provides a quick view of the data for each series.
|
Figure 8-53
|