Using calculated data in a cross tab
To display calculated data in a cross tab, you can create a column that displays calculated data, called a computed measure. When you create a computed measure, you select a function that indicates how to calculate the data. Data Analyzer supports typical mathematical functions, such as percent of total, running sum, difference, product, rank, and ratio. Also, Data Analyzer supports a conditional expression using the IF function.
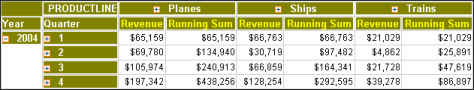
In Figure 4-7, for example, the Running Sum column appears beside the Revenue column in each product line column. The Running Sum column displays the year-to-date sales revenue sum for each quarter and product line.
Figure 4-7  
Because meaningful data analysis requires displaying data in time intervals, Data Analyzer supports calculating data using relative time periods, such as current month, current year, month to date, quarter to date last year, trailing 30 days, and trailing 6 months.
Use Computed Measure to create a computed measure using functions. In Computed Measure, the available options differ, depending on the function you use. Table 4-2 lists available functions and the categories in which they appear. A description of each function appears in Functions.
*
*
*

Additional Links:

© Copyright OpenText Corp. All rights reserved. Privacy Policy | Cookie Policy

BIRT iHub 2