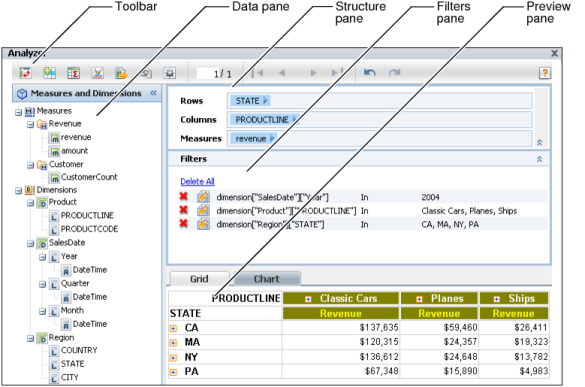
When you start Data Analyzer, your browser displays the following user interface items, as shown in Figure 1-4:
|
Figure 1-4
|
Using the toolbar, shown in Figure 1-4, you can complete the following tasks:
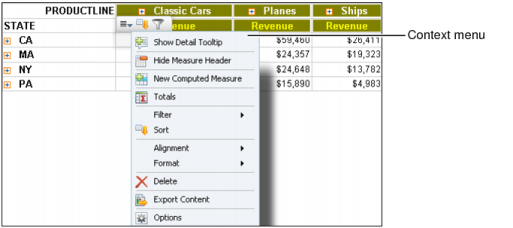
To display additional options for a specific cross tab element, right-click a cross tab element. A context menu displays commands and options next to the cross tab element. For example, Figure 1-5 shows the menu that appears when you right-click a cell in the data area.
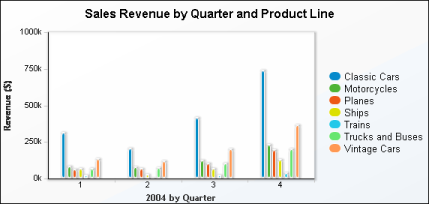
Data Analyzer also supports viewing a chart that uses the cross tab data. Figure 1-6 shows a column chart that displays revenue values for seven product lines for four quarters.
|
Figure 1-6
|