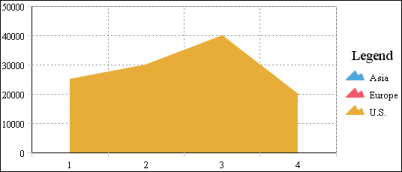
In an overlay area chart, the areas of multiple series overlap, as shown in Figure 8-8. As the example shows, this chart subtype is not suitable for showing multiple series if the data values overlap. In the example, the data for the U.S. obscures the data for Europe and Asia, because the U.S. numbers are the highest for every quarter. Use the overlay area chart if you want to show only one series, for example, only sales for Asia.
|
Figure 8-8
|