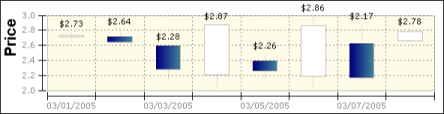
A candlestick stock chart consists of a series of boxes with lines extending up and down from the ends, as shown in Figure 8-24. The top and bottom points of each line indicate the high and low values, respectively. The top and bottom of each box indicate the open and close values. If the close value is higher than the open value, the box is white. If the open value is higher than the close value, the box is shaded. This style enables you to see immediately whether a stock posted a gain or a loss for a given day. The chart in Figure 8-24 shows that the stock posted a gain every day in the trading week except the fourth day.
|
Figure 8-24
|