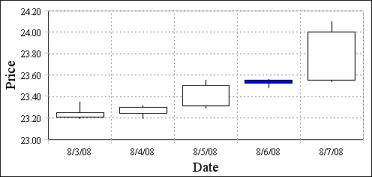
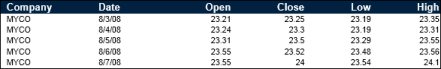
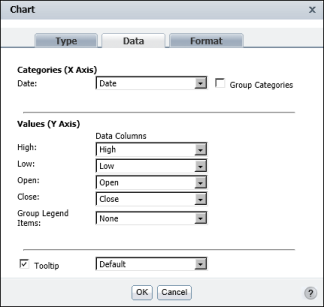
The stock chart in Figure 8-56 shows a stock’s high, low, open, and close values for five days. Figure 8-57 shows the table data that the stock chart uses. Figure 8-58 shows how the data is selected for the chart. The Date column is the category series. The High, Low, Open, and Close columns are the value series.
|
Figure 8-57
|
|
Figure 8-58
|