Selecting data for a cross tab
When building a cross tab, you group the aggregate data by at least two dimensions, for example, sales totals by year and product line or sales totals by product line and state. Often, report users need to view aggregate data by more than two dimensions.
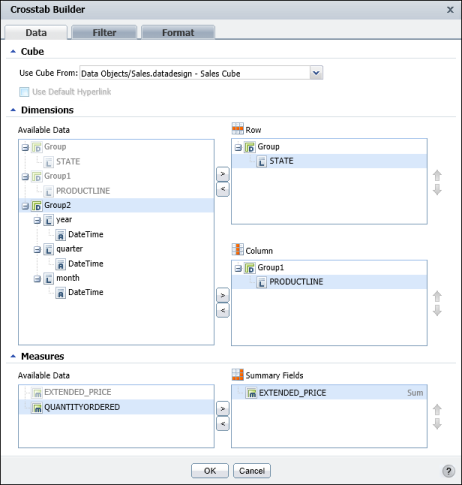
Figure 7-2 shows data selected for a cross tab displaying the sales total by state and product line. To create the cross tab, one dimension (State) is inserted in the row area, and one dimension (Productline) is inserted in the column area.
Figure 7-2  
Each additional dimension by which you group data appears as a column or row, and each additional dimension provides a more comprehensive and detailed view of the data. Just as you can define an unlimited number of dimensions for a cube, you can build a cross tab that displays aggregate data by as many dimensions as needed.
Calculating aggregate data by too many dimensions, however, can result in many empty cells, a problem commonly referred to as data sparsity. When designing a cross tab that contains more than two dimensions, make sure that report processing time is not spent calculating zeros. In addition, a cross tab that contains more than two or three dimensions in either the row or column area is difficult to read. Rather than displaying data by too many dimensions in a single cross tab, consider dividing the data into multiple cross tabs, so the data is easier for the user to understand quickly.

Additional Links:

© Copyright OpenText Corp. All rights reserved. Privacy Policy | Cookie Policy

BIRT iHub 2