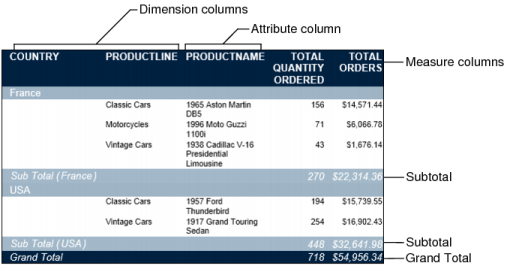
When you design a summary table, first evaluate which dimension, attribute, and measure columns to select, based on the aggregate data you want to display. In the example report, as shown in Figure 6-1, data in the measure column is grouped by the dimension, and displays subtotals in the group footer. Duplicate values in a grouped dimension column do not appear in the summary table. Although there are two dimension columns in the example in Figure 6-1, the outermost column is used to group data in the other columns. The attribute column, Product Name, is an attribute of the Product Line dimension. You can perform multiple aggregate calculations for data in a single measure column. A grand total is displayed in the report table footer.
|
Figure 6-1
|
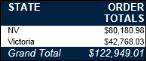
Although each attribute column must be associated with a dimension column for it to be useful in a summary table, you do not need a dimension column to create a meaningful summary table. The example, as shown in Figure 6-2 displays order totals, the measure column, for each state, the attribute column, and a grand total for all states.
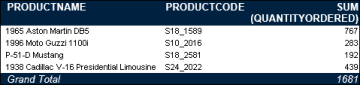
The example, as shown in Figure 6-3, displays the grand total for two peer attribute columns and a measure column.
|
Figure 6-3
|