Grouping and sorting category data
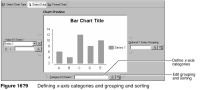
When the expression returns too many categories to fit on the x-axis, on the meter, or in a pie, you need to use the grouping functionality in the chart builder, as shown in Figure 16‑9.
You can group text, numeric, or date-and-time data. For example, the Classic Models database includes all of these data types, as shown in
Figure 16‑10.
Figure 16‑10 Previewing data types in the Classic Models database
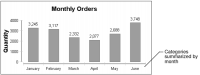
Plotting every order across the
x-axis creates so many bars that a user cannot read the values in the chart. To plot order information more clearly in a bar chart, group categories that appear on the
x-axis by month, as shown in
Figure 16‑11.
Figure 16‑11 X-axis categories grouped by month