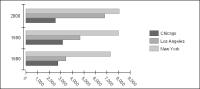
Transposing the axes of a chart plots categories on the vertical axis and values on the horizontal axis.
Figure 16‑21 shows a bar chart using transposed axes.
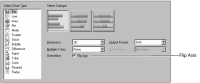
Two-dimensional charts and charts using depth support transposing axes. Three-dimensional charts do not support transposing axes. To transpose axes, navigate to the Select Chart Type page, then select Flip Axis, as shown in
Figure 16‑22.