Previewing data and chart
From within the chart builder, you can see some of the data in the data set linked to the chart. Previewing sample data can help you decide which column to use to plot the
x- and
y-axis. For example, in
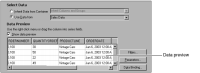
Figure 16‑27, Data Preview shows several columns of data from the Classic Models database that ships with BIRT.
Figure 16‑27 Previewing the data in the chart builder
Data Preview serves another important purpose as you define charts. You can drag and drop the columns from Data Preview to the value, category, and optional Y grouping definitions in the upper portion of Select Data.
As you set up the expressions that specify the data for your chart, Chart Preview presents a rough idea of how your published chart will look.
Figure 16‑28 shows the chart preview of a bar chart.
Figure 16‑28 Previewing chart data on Select Data
You can change some characteristics of chart previews to improve performance. As you design a chart, the chart preview uses either live data, as shown in
Figure 16‑28, or randomly generated sample data, as shown in
Figure 16‑29. You can also change the number of data rows that appear in the chart builder. By default, the Data Preview section shows six rows of data. You can display more or fewer rows.
Figure 16‑29 Bar chart preview using random data