Using multiple dials in a chart
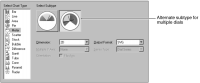
To show multiple dials, select the alternate subtype when you choose the chart type, as shown in
Figure 16‑37.
Figure 16‑37 Selecting the subtype, meter chart that uses multiple dials
You can also use multiple series definitions to create multiple meters or a meter with multiple needles. For example, the chart in
Figure 16‑38 is a superimposed meter chart that shows multiple needles in one meter. One needle shows the interior temperature, 201. The other needle shows the exterior temperature, 303.
Figure 16‑38 Super-imposed meter chart
The first meter value series expression is row["InteriorTemp"]. The second meter value series expression is row["ExteriorTemp"]. The chart does not use Optional Grouping. The Category Definition is a string containing a single space, " ".
To provide more than one meter value series expression, use the meter value series drop-down list. Select New Series, then use the expression field to supply the series expression. After adding one or more series, use the drop‑down list to navigate among the meter value series definitions.