Task 7: Display aggregate information
One of the benefits of grouping data is that you can add summary information at the beginning or end of each group. Summary information is also known as aggregate information. In this procedure, add the following aggregate information to the report:

The number of customers in each group

The number of all customers listed in the report
Display the number of customers in each group
1 Choose Layout to return to the layout editor.
2 In the palette, under Quick Tools, drag an aggregation element and drop it in the second cell in the group footer row. Elements that are in the group footer appear at the end of every group.
3 In Aggregation Builder, specify the following values:
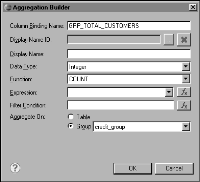
1 In Column Binding Name, type the following name:
GRP_TOTAL_CUSTOMERS
2 In Function, select COUNT. BIRT selects the appropriate data type, integer.
3 In Aggregate On, select Group and credit_group. This value indicates that the COUNT function returns the number of rows in each credit limit group.
Figure 9‑41 shows the complete definition for the aggregation element.
Figure 9‑41 Aggregation Builder displaying values for getting the count of customers in each credit limit group
4 Choose OK. In the report design, shown in
Figure 9‑42, the aggregation element displays the sigma symbol followed by the column binding name.

[GRP_TOTAL_CUSTOMER]
Figure 9‑42 Report design displaying the aggregation element
4 Preview the report. The report displays the number of customers at the end of each group.
Figure 9‑43 shows the number of customers, 37, for the first credit limit group.
Figure 9‑43 Report preview showing a count for each group
5 Choose Layout to return to the layout editor.
6 Instead of displaying just the number of customers in each group, display the following text before the total:
Customers:
1 Drag a text element from the palette, and drop it in the first cell in the group footer row.
2 In Edit Text Item, select HTML from the drop-down list that displays Auto.
3 Specify the following text in the text area, shown in
Figure 9‑44:
Customers: <VALUE-OF>row["GRP_TOTAL_CUSTOMERS"]</VALUE-OF>
In a text element, the <VALUE-OF> tag supports the display of dynamic data. The expression, row["GRP_TOTAL_CUSTOMERS"], is a reference to the column binding you created to return the number of customers in each credit limit group.
Figure 9‑44 Text specified for the text element
4 Choose OK to save the edits to the text element.
7 Preview the report.
8 Scroll to the bottom of the first credit limit group. The report should look like the one shown in
Figure 9‑45. The group footer displays the following information:
Customers: 37 37
Figure 9‑45 Report preview showing the text displayed by the text element
9 Choose Layout to return to the layout editor.
10 Delete the aggregation element from the second cell in the group footer row to remove the second total, which is now redundant.
Display the total number of customers in the report
In the previous procedure, you added aggregate data by inserting the aggregation element from the palette. This time, you add aggregate data by creating a column binding through the table’s Binding page.
1 Select the table.
2 In Property Editor, choose the Binding tab. The Binding page, as shown in
Figure 9‑46, displays all the column bindings used by elements in the table.
Figure 9‑46 Column bindings displayed
3 Choose Add Aggregation to create a new column binding that defines an aggregate expression.
4 In Aggregation Builder, specify the following values:
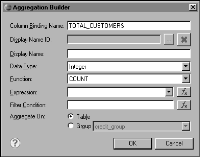
1 In Column Binding Name, type the following name:
TOTAL_CUSTOMERS
2 In Function, select COUNT.
3 In Aggregate On, select Table. This value indicates that the COUNT function returns the number of rows in the table.
Figure 9‑47 shows the complete definition for the aggregation element.
Figure 9‑47 Aggregation Builder displaying values for getting the count of customers in the table
4 Choose OK. The new column binding, TOTAL_CUSTOMERS, is available for use by any element in the table.
5 Select the table, if necessary. Guide cells appear at the top and left side of the table.
6 Right-click the guide cell on the left of the first row, Table - Header, then choose Insert➛Row➛Above. A new table header row appears above the row that displays the column headings. The new row appears in color because it inherits the properties of the row below it.
7 Select the new row. In Property Editor, under Properties, in General, set Background color to white.
8 Drag a data element from the palette, and drop it in the first cell in the new table header row.
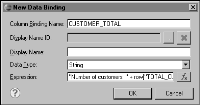
9 In New Data Binding, create a new column binding:
1 In Column Binding Name, type the following name:
CUSTOMER_TOTAL
2 In Data Type, use the default, String.
3 In Expression, choose the expression builder button.
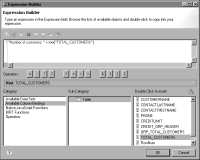
4 In the expression builder:

Type the following text:
"Number of customers: " +

In the lower pane of the expression builder, select Available Column Bindings, select Table, then double-click TOTAL_CUSTOMERS, the column binding you created to get the number of customers in the table. The expression, row["TOTAL_CUSTOMERS"] appears after the text you typed in the text area, as shown in
Figure 9‑48.
Figure 9‑48 The expression builder displaying the expression that refers to the TOTAL_CUSTOMERS column binding

Choose OK. The expression appears in the Expression field on New Data Binding, shown in
Figure 9‑49.
Figure 9‑49 Column binding defined
5 Choose OK to save the column binding. The report design should look like the one shown in
Figure 9‑50.
Figure 9‑50 Report design showing a total count for customers
10 Preview the report. The report displays the number of customers at the beginning of the table, as shown in
Figure 9‑51. The text is centered within the column. You re-format this text later.
Figure 9‑51 Report preview showing a total number of customers


