Task 10: Display credit limit ranges in the table of contents
Rather than display the first value of each credit limit group, the table of contents makes more sense if it displays the same credit limit range values as the report. You accomplish this task by using the same JavaScript expression that you used previously to display credit limit ranges (0 ‑ 49999, 50000 ‑ 99999, and so on) in the group header.
1 Return to BIRT Report Designer.
2 In the layout editor, select the table, then choose the Groups tab in Property Editor.
3 Double-click credit_group in the list of groups.
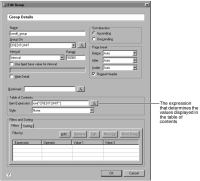
Edit Group, shown in
Figure 9‑61, displays the properties of the group. Under Table of Contents, Item Expression is set, by default, to the grouping field, row["CREDITLIMIT"].
Figure 9‑61 Edit Group displaying the properties of credit_group
4 Choose the expression builder button, and, in the expression builder, replace the row["CREDITLIMIT"] expression with the following expression. This expression is the same column-binding expression that is used by the data element, [CREDIT_GRP_HEADER], in the group header. Rather than typing the expression again, you can copy it from the data element and paste it here.
for(i=50000; i<300000; i+=50000){
if( row["CREDITLIMIT"] < i ){
rangeStart = i-50000;
rangeEnd = i-1;
break;
}
}
displayString = rangeStart + " - " + rangeEnd;
Choose OK to save the expression.
6 Choose OK to save the edits to the group.
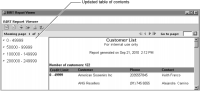
7 Preview the report in the report viewer to verify the change in the table of contents. The table of contents displays the credit limit ranges, as shown in
Figure 9‑62.
Figure 9‑62 Updated table of contents