A template typically contains visual elements, such as tables, charts, and labels. It can, however, also contain defined data sets, which specify the data to display in a report. A template can even be a complete report that presents professionally formatted data.
Before you begin creating templates, gather the following basic information:
What data will the Report Studio user use in a report?
How does the user want to present the data?
What does the user need as a starting point for a report?
The rest of this section provides tips for creating effective templates.
Separating or combining visual and data elements
When designing a template, one of the key decisions you make is whether to include both visual and data elements in the template or keep them separated. Good design typically dictates that templates contain only visual elements, and that data objects or data objects contain the data. You might decide, however, to create templates that include data, because some users, particularly inexperienced users, prefer to view a report without having to do anything other than select the template.
Templates that contain only visual elements are more versatile. A single template can be used for different reports that present different data. The user can mix and match data objects or data objects with templates. From a development and administrative perspective, separating presentation from data can be efficient and optimal, because template design and data retrieval can be accomplished by developers with design expertise and data-retrieval expertise, respectively. This strategy, however, requires that the template designer and the data architect coordinate to ensure that the templates and data are suitable for use together.
Designing themes
Report Studio provides several options for formatting the contents of a report. The standard toolbar provides the user with formatting options to modify the font, color, style, text alignment, and other properties of individual report items. The report design area on the left side of Report Studio displays themes, if any are provided, that the user can select to apply a set of styles to the entire report.
A theme is a collection of styles. The concept and functionality of styles are similar to styles in Microsoft Word and cascading style sheets (CSS). Designers create a theme to apply a consistent style, or look and feel, to a report. A theme, for example, can specify the colors used in a report, the font used for different text, label, or data items, the spacing or alignment of items, border styles, and so on.
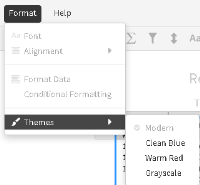
Report Studio provides four themes with the default templates, as shown in Figure 3‑1.
Figure 3‑1 Themes provided with the default templates
When you create a template, consider creating different themes, so that the user can choose from multiple styles. While the creation of a theme is optional, it is standard practice among designers, similar to the use of cascading style sheets with web pages. Themes are stored in a BIRT library file, separate from the template file.
Defining all the styles in a theme within a library, rather than applying formats to individual report items in the template, makes it easier to maintain and update the appearance of a template. When a user requests new or modified styles to use with a particular template, all you do is update the theme in the library, then publish the latest version of the library. You do not need to modify the template file.
Improving usability
A template should be intuitive to use. The user should be able to quickly determine how to use the elements in a template, and be able to freely edit most elements. The following are some guidelines for improving the usability of a template:
Set the general properties of the template file:
The display name of the template
A brief description of the template
The image to use as the thumbnail image of the template
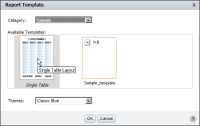
These properties are not required. However, if you do not specify a display name, the name of the template file is used. If you do not supply a description, the word “null” appears, and if you do not specify an image, the user sees a gray box with the x icon. Figure 3‑2 shows what the user sees on the Report Template page when a template’s properties are set and when the properties are not set.
Figure 3‑2 Displaying two templates: one with properties set, one without properties set
Decide which report elements in the template are editable. Examples of editable elements include label elements for displaying report titles, section titles, or column headings, and empty tables into which users insert data. Examples of non-editable elements include company logos and standard copyright statements.
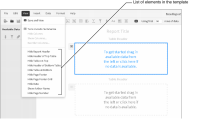
Provide meaningful names for each report element, so the Report Studio user can easily identify the type and purpose of the element. If you do not specify a name, Report Studio displays the name of the element type, such as Text or Label. If your template contains three labels, and you do not specify a name for any of the labels, Report Studio displays Label three times in the View menu. The View menu lists all the elements in the template, so users can choose whether to display the elements in the report. Figure 3‑3 shows one of the default templates with several elements listed in the View menu. The elements have descriptive names.
Figure 3‑3 Report items listing all the template elements
Provide instructions for using each editable element. For example, a table can display a message, such as “To insert data in this report, drag the columns you want from Available Data and drop them in this table.” Figure 3‑3 shows a table with detailed instructions.