How to group categories on the x-axis
1 In the chart builder, in Select Data, choose Edit Group and Sorting. Figure 16‑9 shows the location of Edit Group and Sorting.
2 In Data Sorting, select Ascending or Descending.
3 In Sort On, type or select a value.
4 In Grouping, select Enabled to see the grouping options shown in
Figure 16‑12.
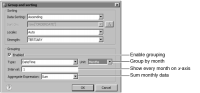
Figure 16‑12 Grouping category data by month
5 Use the following options to set up a group:

In Type, select Text, Numeric, or DateTime. If you select DateTime, you can specify the units to use to form the groups, such as Months.
In Interval, select a number that represents the size of the groups to create. For example, to group three-row sequences of text data, select 3. To group numeric data in sections of four, select 4.
In Aggregate Expression, select the function to use to aggregate the data in the group. You can select Average, Sum, Count, Distinct Count, First, Last, Minimum, and Maximum.