The category values appear in the chart in the order that the query returns them. You can sort the data so that it appears in a different order on an axis, in a dial, or in a pie. For example, you can show cities along the
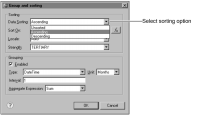
x-axis in alphabetical order. Similarly, you can show customer ranks in descending numeric order around a pie. Charts support sorting data in an ascending or a descending order. To sort data, in Select Data, choose Edit Group and Sorting. In Data Sorting, select Ascending or Descending, as shown in
Figure 16‑13.