Using data from a cross tab
A cross tab is the ideal element for displaying aggregate data, or measures, by multiple categories. Many types of charts are also suitable for displaying aggregate data by different categories, although not by as many categories as a cross tab. To show aggregate data by x and by y, use a chart to present the data graphically and a cross tab to present the data in a compact row-and-column matrix.
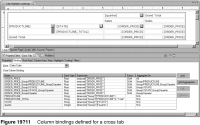
To present the same data in both elements, it makes sense for a chart to leverage the data in the cross tab. After you define the initial measures in the cube and insert them in a cross tab, the cross tab calculates all the subtotals and grand totals and creates all the necessary column bindings. The report in Figure 19‑3 shows three charts—order totals by product line, totals by quarter, and totals by product line and by quarter—based on a single cross tab. Figure 19‑11 shows the column bindings that BIRT creates for each measure and dimension in that cross tab.
When specifying data for a chart that uses cross tab data, all you do is select a measure to use as the value series. You do not select a dimension for the category series because a measure already defines the category or categories by which the aggregate data is grouped. For example, the measure defined by the column binding ORDER_PRICE_Group/PRODUCTLINE returns the sum of order prices by product line groups. ORDER_PRICE_Group/PRODUCTLINE_Group2/quarter returns the sum of order prices by product line and by quarter.
Based on the measure you select, the chart builder assigns the appropriate dimension to the category series and, if applicable, to the optional Y series grouping as well.
Figure 19‑12 shows the measure ORDER_PRICE_Group/PRODUCTLINE_Group2/quarter selected for the value series. The chart builder assigns data["PRODUCTLINE"] to the category series and data["quarter"] to the optional y series grouping. As the Chart Preview shows, the chart displays order price totals by product line and by quarter.
Figure 19‑12 Cross tab data used in a chart