How to create a chart that uses data from a cross tab
This procedure assumes you have already created the cross tab that contains the data to use in the chart.
1 Specify a name for the cross tab, using the following steps:
1 Select the cross tab and in Property Editor, choose the Properties tab.
2 In General properties, in Name, type a name for the cross tab.
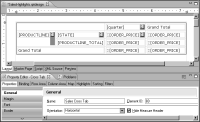
Figure 19‑13 shows the name, Sales Cross Tab, specified for a selected cross tab.
Figure 19‑13 Name property set for a selected cross tab
2 Insert a chart in the desired location in the report.
3 In the chart builder, select a chart type suitable for displaying the data, then choose Select Data.
4 Select the data to display in the chart, using the following steps:
1 Under Select Data, select Use Data From, and click the down arrow to display a list of items from which to get data.
2 Under Report Items, select the cross tab that contains the data to use.
3 Select a measure to use as the chart’s value series. Under Value (Y) Series, below Series 1, click the down arrow to display the cross tab measures, then select one of the measures.
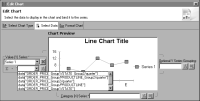
Figure 19‑14 shows an example of a list of measures.
Figure 19‑14 List of measures available for a value series
After you select a measure, the chart builder selects the appropriate data for the category series, and if applicable, the data for the optional Y series grouping. For example, if you select a measure that calculates the order totals by quarter, the chart builder selects the quarter data field for the category series, as shown in
Figure 19‑15.
Figure 19‑15 Data specified for a chart
4 Choose Finish to save the chart.
5 Preview the report to verify that the chart displays the correct data.


